CFRM 503 Project
Performance Attribution Report
Introduction
This report has been prepared at the request of the Chief Investment Officer (CIO) to rigorously evaluate the performance of our investment process, specifically focusing on the skills of our personnel in managing the multi-asset investment strategies that form the core of our offerings.
Our firm operates with a dynamic approach to asset management, which includes a diverse array of asset categories such as Stocks, Bonds, and Alternatives, where each of the asset category contains 3 different asset classes. This analysis will focus on the two multi-asset funds: the 60/30/10, 50/45/5 Funds, and the performance attribution for the Stocks, Bonds and Alternatives.
Goal
The CIO has specified the need to assess the ability of our investment personnel to add value through several key dimensions:
| Category | Asset Class | Dimensions |
|---|---|---|
| Multi-Asset | 60 Stocks/30 Bonds/10 Alternatives Fund 50 Stocks/45 Bonds/5 Alternatives Fund |
Allocation |
| Stocks | U.S. Large Cap U.S. Small Cap Non-U.S. Markets |
Allocation Capitalization Country Selection |
| Bonds | Short Treasuries Long Treasuries Investment Grade Corporate Bonds |
Allocation Duration Credit Quality |
| Alternatives | Listed Real Estate Commodities Listed Infrastructure |
Allocation |
Methodology
The data is provided by the CIO, which contains five years of weekly returns of the firm’s actively-managed investment products (by asset class) as well as the weekly returns of the associated benchmarks for each asset class, ranging from 2019-01-11 to 2023-12-29.
We will use performance attribution to numerically determine the effectiveness of our investment decisions and the skill of our personnel in managing the portfolio across different asset classes and strategies. We made the simplifying assumption that the benchmark weights among the investments and the actual weights to the investments have been fixed over the 5-year horizon with rebalancing to these fixed weights occurring at the end of each week.
Analysis
Stocks
| Allocation | Capitalization | Country Selection | |
|---|---|---|---|
| Mean | 0.00004741 | -0.00000928 | 0.00005344 |
| Sd | 0.00052688 | 0.00016117 | 0.00053029 |
| Min | -0.00220511 | -0.00083643 | -0.00226437 |
| Max | 0.00191260 | 0.00046537 | 0.00212749 |
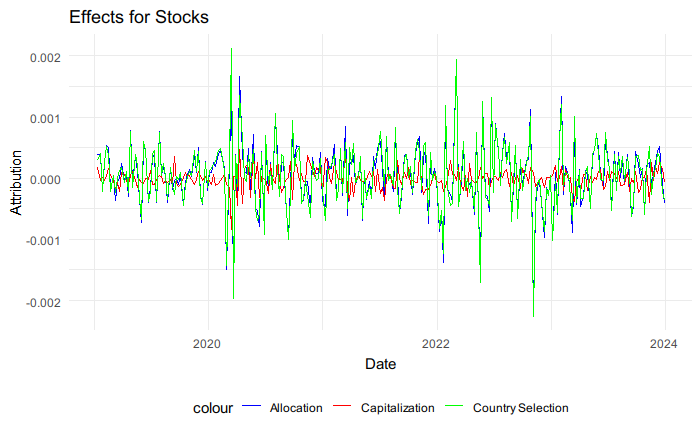
The average allocation effect for stocks is slightly positive, suggesting a modest average gain from allocation decision over five years. Country selection effect has similar results to the allocation effect, both in the average gain and moderate variability. However, the capitalization effect is slightly negative at -0.00000928, implying a small average loss from capitalization decisions (large vs. small cap). It is recommended to re-evaluate the choices between large and small caps.
Again from the plot, the green line which is the country selection effect fluctuates the most, with the highest standard deviation, followed by the allocation effect, which has a lot overlapping with the country selection line. All three lines cross frequently, indicating no single strategy consistently outperforms the others over time.
Bonds
| Allocation | Duration | Credit Quality | |
|---|---|---|---|
| Mean | -0.00002282 | -0.00003411 | -0.00000542 |
| Sd | 0.00064698 | 0.00104821 | 0.00013286 |
| Min | -0.00190292 | -0.00376718 | -0.00045129 |
| Max | 0.00208725 | 0.00328791 | 0.00094077 |
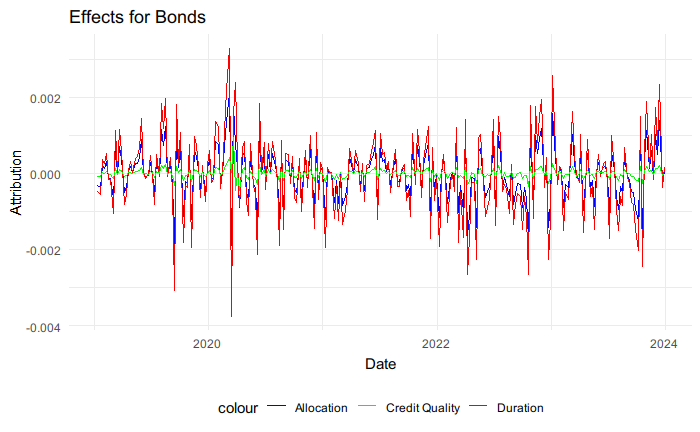
For the bonds, the means are all negative for the three effects, indicating that entire Bonds portfolio slightly detracted from benchmark performance. The standard deviation of duration effect is notably higher than the other two, indicating greater volatility in the effectiveness of duration management.
Again, in the graph, the red line representing duration fluctuates the most, followed by the blue line representing allocation.
The generally negative mean effects for allocation, duration and credit quality suggest a need for reevaluation of the strategies used in these areas. There may be opportunities to enhance returns by improving the forecasting and decision-making processes related to interest rates and market dynamics.
Alternatives
| Allocation | |
|---|---|
| Mean | 0.00002673 |
| Sd | 0.00173345 |
| Min | -0.00613441 |
| Max | 0.00853481 |
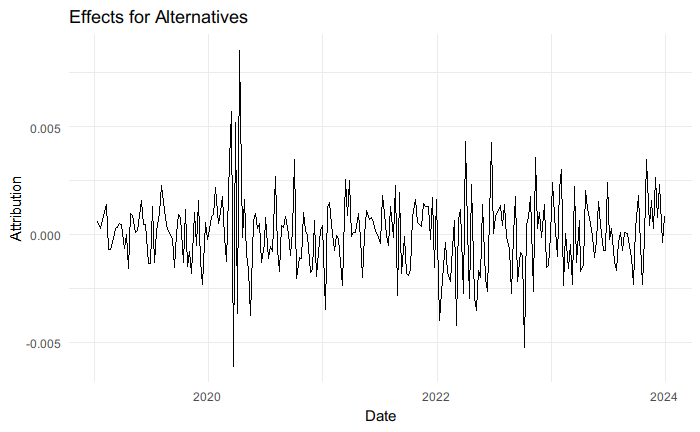
The mean allocation effect for alternatives is slightly positive which is a good sign. However, it also has the highest standard deviation compared to any other effect before, indicating the outcomes are quite diverse and can swing widely from week to week. The high volatility in the allocation effects for alternatives is indicative of a high-risk, high-reward investment strategy. Given the nature of alternative investments, which often include assets like commodities, real estate, and hedge funds, this variability is expected. Given this, a strategic review of the allocation policies within the alternatives category may be warranted.
Multi-Asset
| 60/30/10 Fund | 50/45/5 Fund | |
|---|---|---|
| Mean | 0.00006604 | 0.00005931 |
| Sd | 0.00127805 | 0.00088118 |
| Excess Return (Alpha) | -0.0001538659 | -0.0001605966 |
| Tracking Error | 0.06166119 | 0.05072926 |
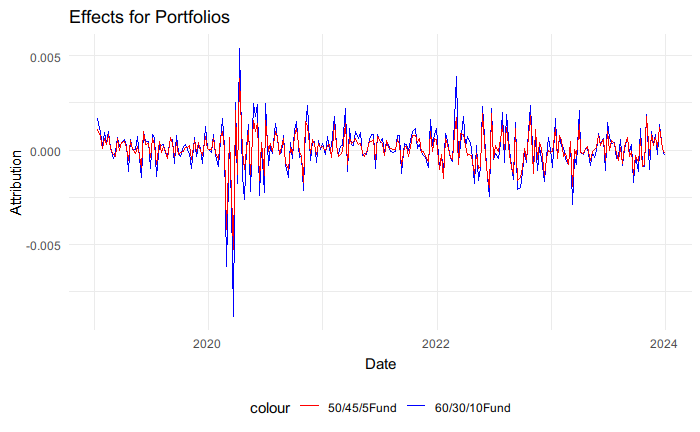
The mean allocation effect for both funds, 60/30/10 and 50/45/5 are slightly positive, but their excess returns are slightly negative, suggesting that on average, the funds underperformed the benchmark after adjusting for risk. Both funds appear to struggle with maintaining a performance edge over their benchmarks, as indicated by their negative alphas. This might suggest that the risk taken by these funds is not adequately compensated by higher returns.
The graph shows that after 2020, there are periods where both funds significantly underperforms the benchmark. The onset of the COVID-19 pandemic in early 2020 led to unprecedented market volatility and economic uncertainty. This could have disrupted the original asset allocation strategies when we started the fund. If the funds were overexposed to high-risk assets without adequate hedging or diversification during tough times, this could lead to greater losses compared to more conservative benchmarks. Since we are not rebalancing the portfolio, it will for sure leave the fund exposed to unfavorable conditions like this.
Conclusion
The comprehensive evaluation of our investment funds spanning several key dimensions of performance, has provided a detailed insight into the strengths and areas for improvement within our investment strategies. The key findings are below.
Strength: The allocation in the stocks category generally added marginal value, with a positive mean effect in allocation. Alternatives showed a positive mean allocation effect, albeit small, indicating successful selections in the asset class.
Weakness: Both funds exhibited negative alpha, indicating underperformance relative to risk-adjusted benchmarks. The effects for Bonds are all negative suggesting a review in the allocation policy.
In short, the alternatives performs the best over the benchmark followed by the stocks. Both multi-asset funds have slightly positive allocation effect but slightly negative alphas with moderate tracking error. Lastly, the bonds performs the worst of all. It is recommended to refine the approach to capitalization within stocks, the entire allocation process for bonds and a closer alignment of both fund strategies with the benchmarks.
Appendix
The following is the weekly performance attribution.